Plot beta credible intervals for transition matrix entries
Source:R/CrI_matrix.R
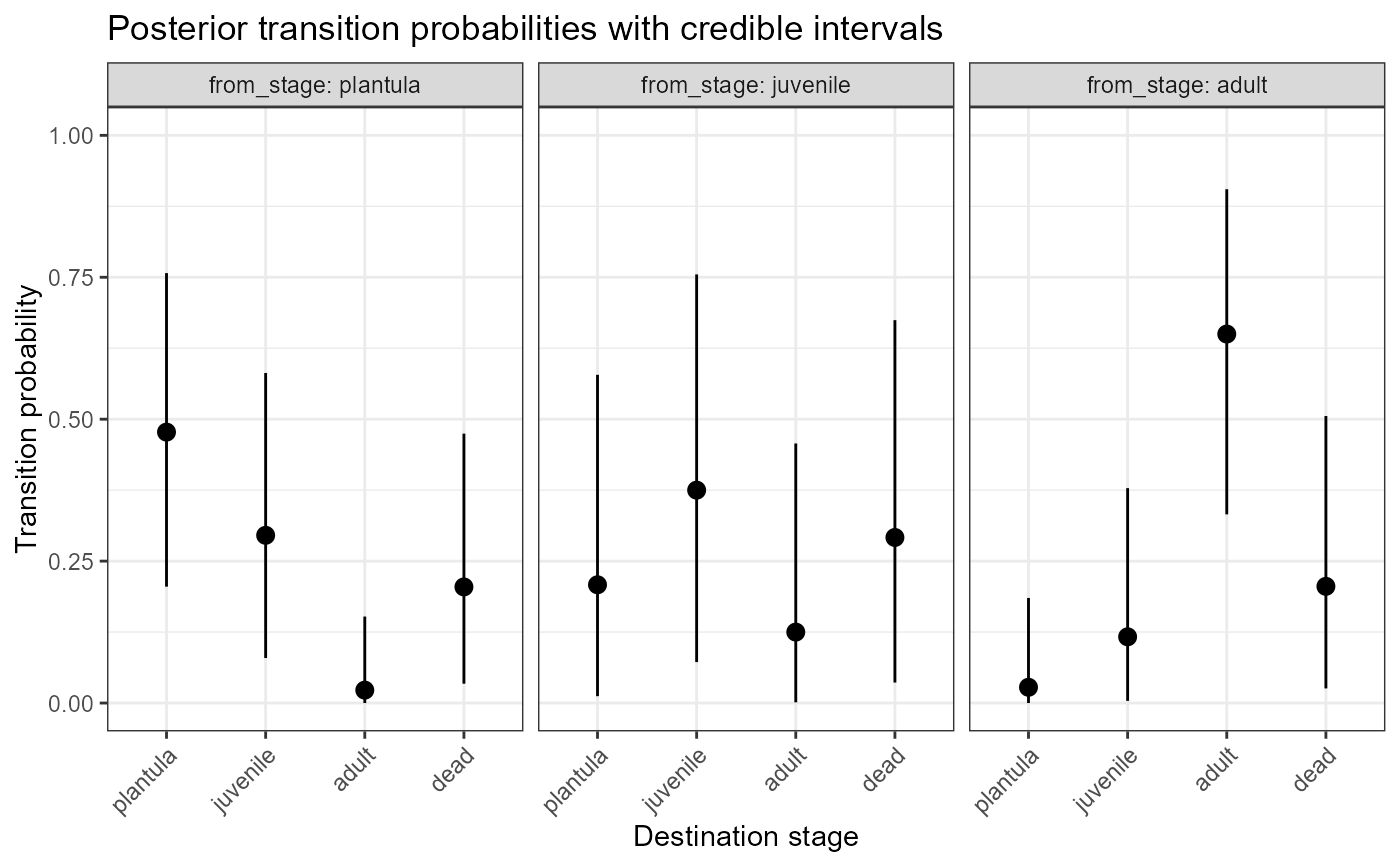
plot_transition_CrI.RdCreates a ggplot2 visualisation of the posterior mean transition
probabilities and their credible intervals for each stage, including the
probability of dying. Each panel shows the fate distribution from one
source stage.
Usage
plot_transition_CrI(
  cri,
  include_dead = TRUE,
  title = "Posterior transition probabilities with credible intervals"
)
Arguments
- cri
A data frame as returned by
transition_CrI.- include_dead
Logical. Whether to include the dead fate in the plot. Defaults to
TRUE.- title
Character. Plot title. Defaults to
"Posterior transition probabilities with credible intervals".
See also
transition_CrI for computing the credible intervals.
Examples
T_mat <- matrix(c(0.5, 0.3, 0.0,
0.2, 0.4, 0.1,
0.0, 0.1, 0.7), nrow = 3, ncol = 3)
F_mat <- matrix(c(0.0, 0.0, 1.5,
0.0, 0.0, 0.0,
0.0, 0.0, 0.0), nrow = 3, ncol = 3)
TF <- list(T = T_mat, F = F_mat)
N <- c(10, 5, 8)
cri <- transition_CrI(TF, N, stage_names = c("plantula", "juvenile", "adult"))
# Include dead fate (default)
plot_transition_CrI(cri)
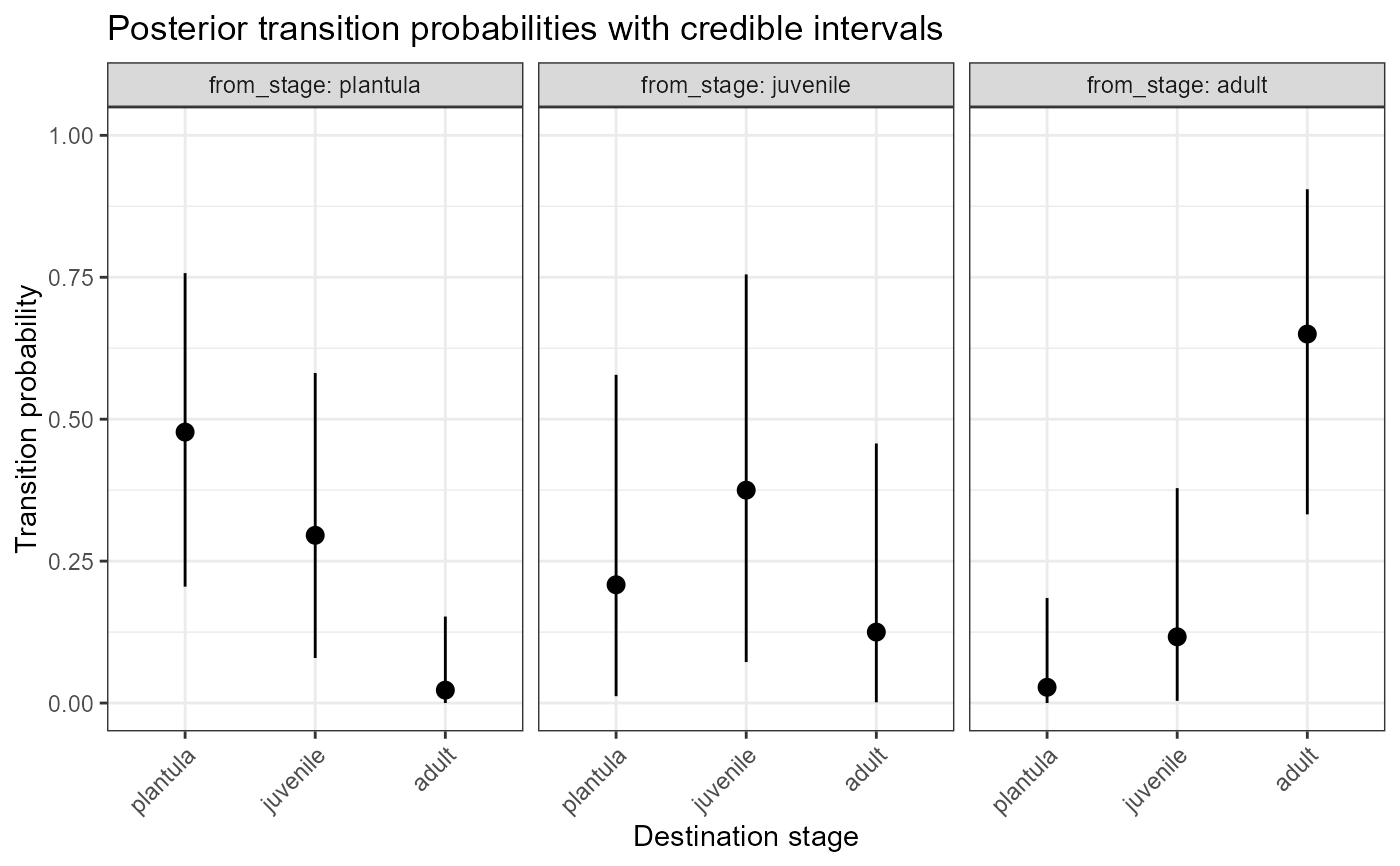
 # Exclude dead fate
plot_transition_CrI(cri, include_dead = FALSE)
# Exclude dead fate
plot_transition_CrI(cri, include_dead = FALSE)